Intro
Newsletter
Maps & Data Visualisation
I - 3D Maps and Networks
II - 2D Data Visualisation & Animation
III - 3D Motion Design
IV - 30DayMapChallenge - 2021 to 2023
V - 30DayMapChallenge - 2021
The Tokyo Eat Map Dream
The Geology of the Moon
The Breathing Planet
World Cup 2026
Behind-the-scenes
Collabs & Comissions
Contact
Awards
Store & Prints
Tutorials & Talks
Digital Art
Digital Painting
3D Art
Graphic Design
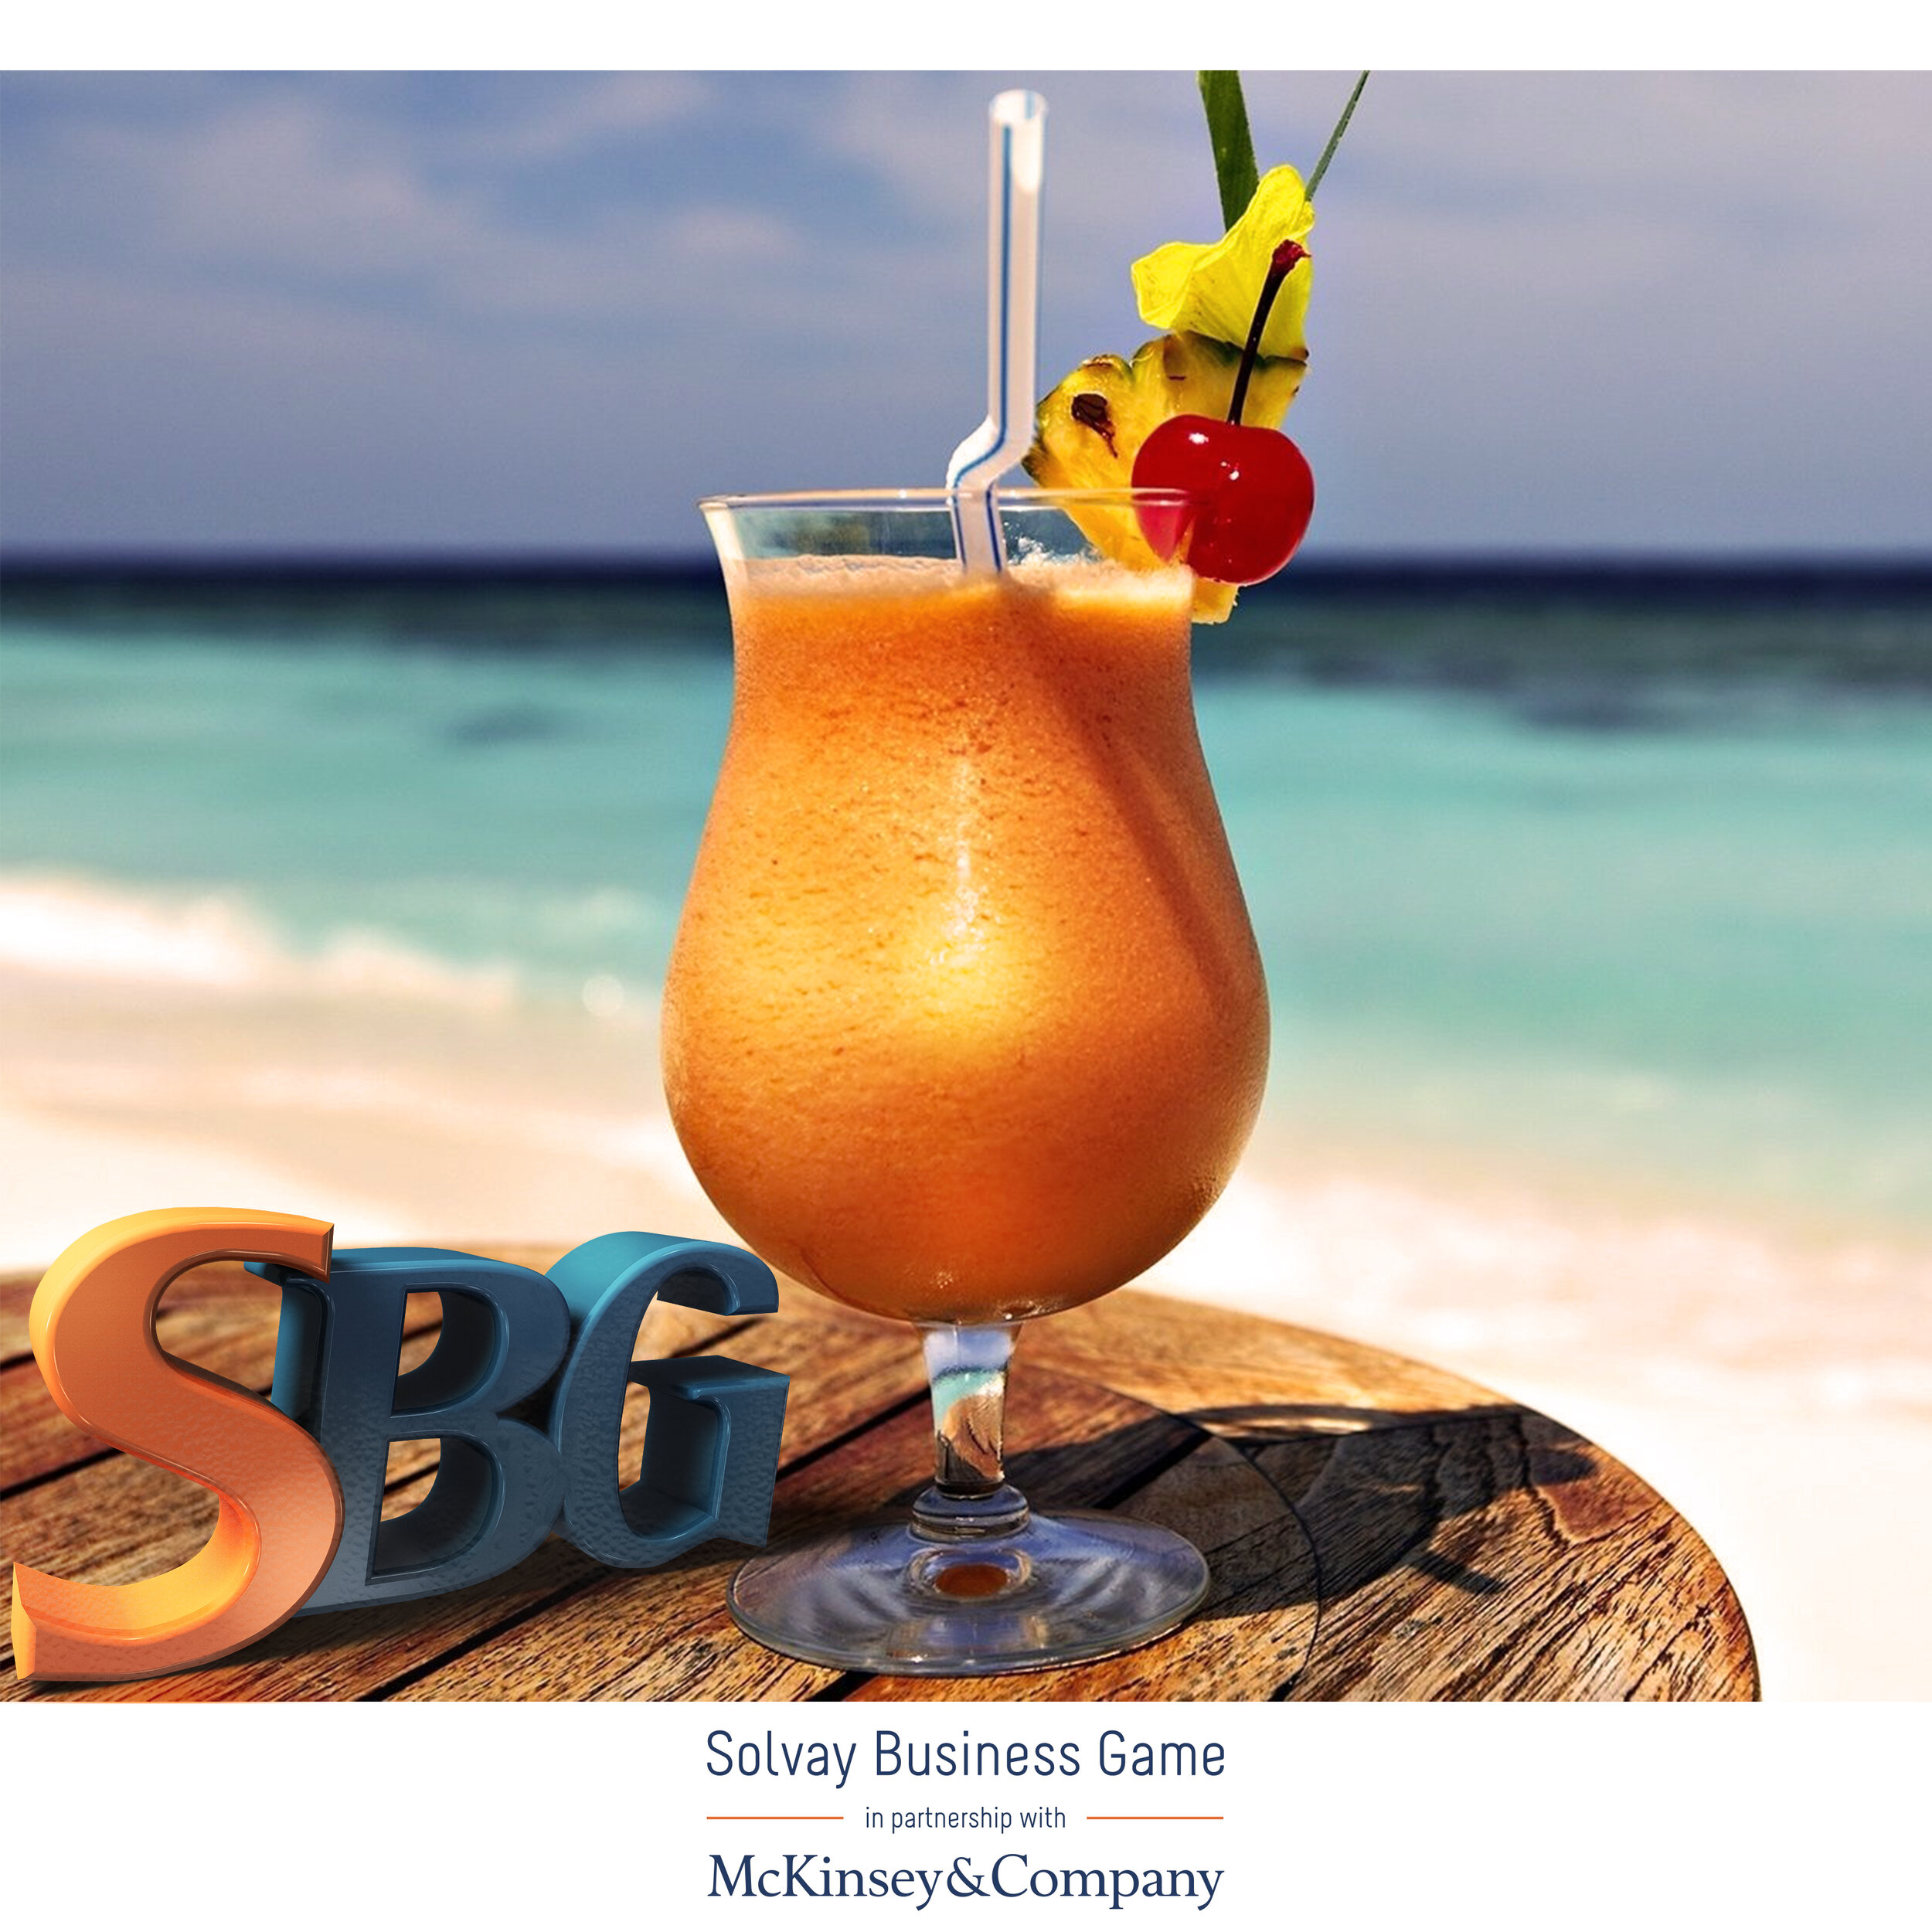
I. Logos & Icons
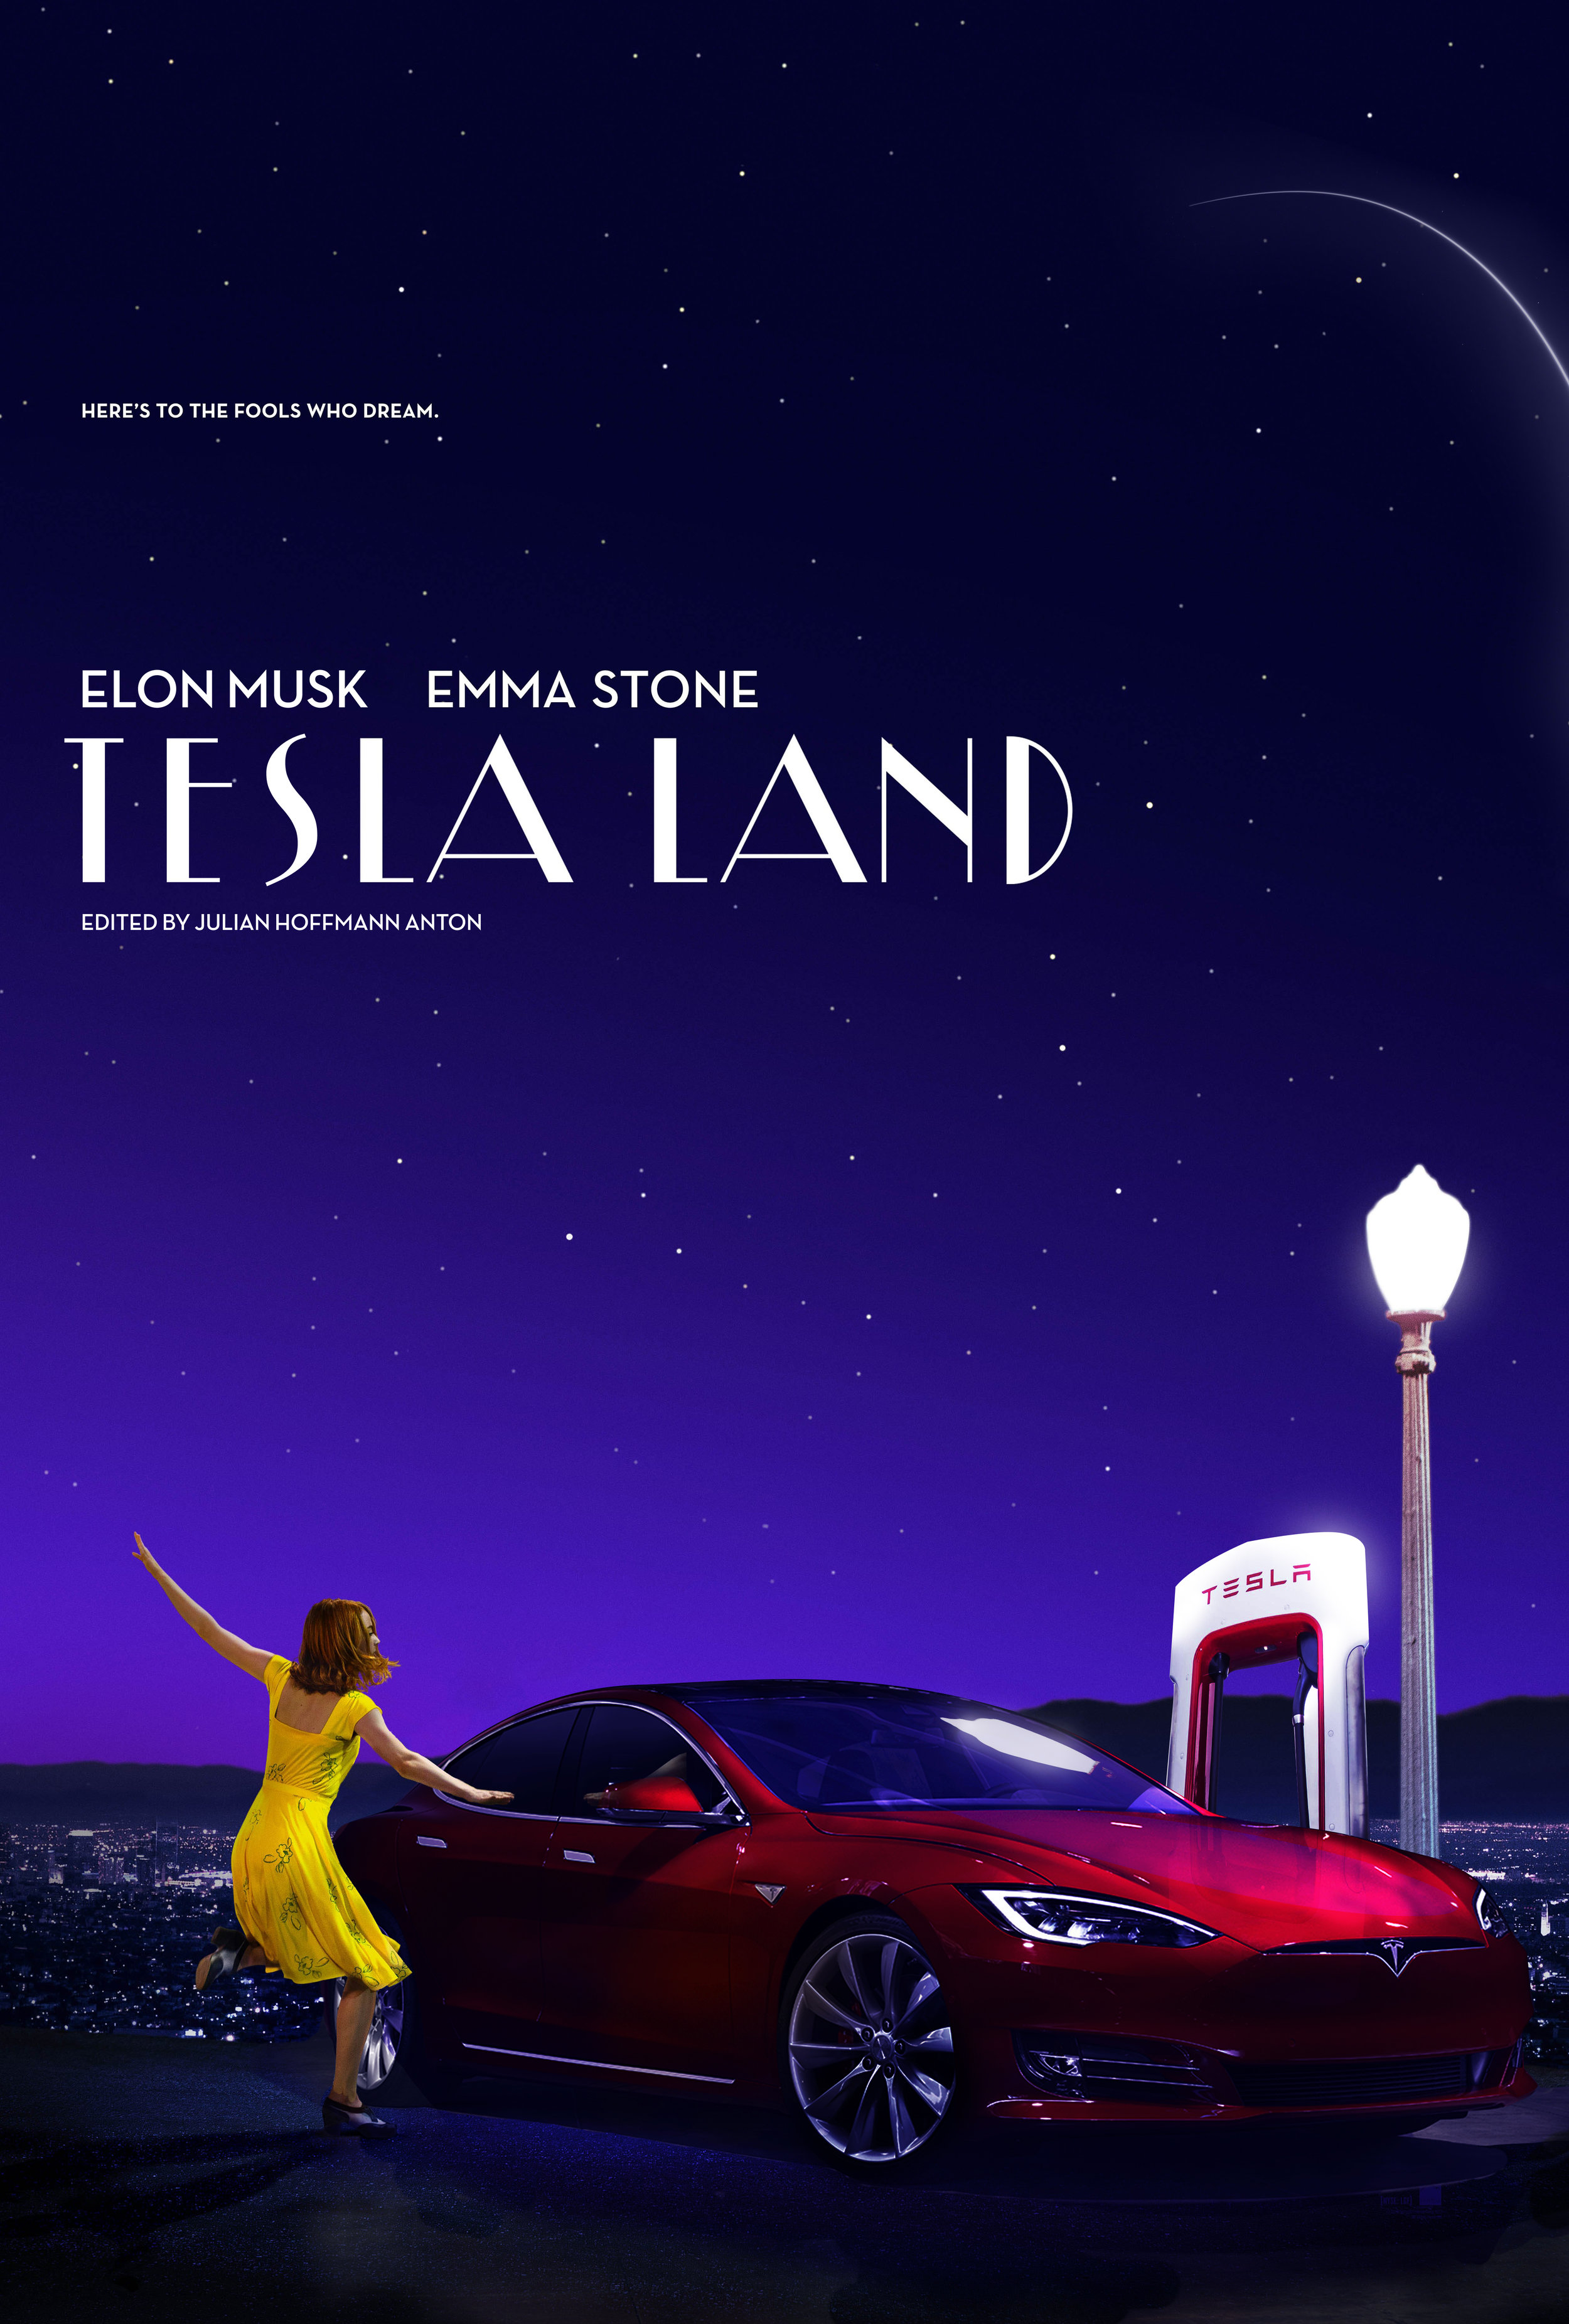
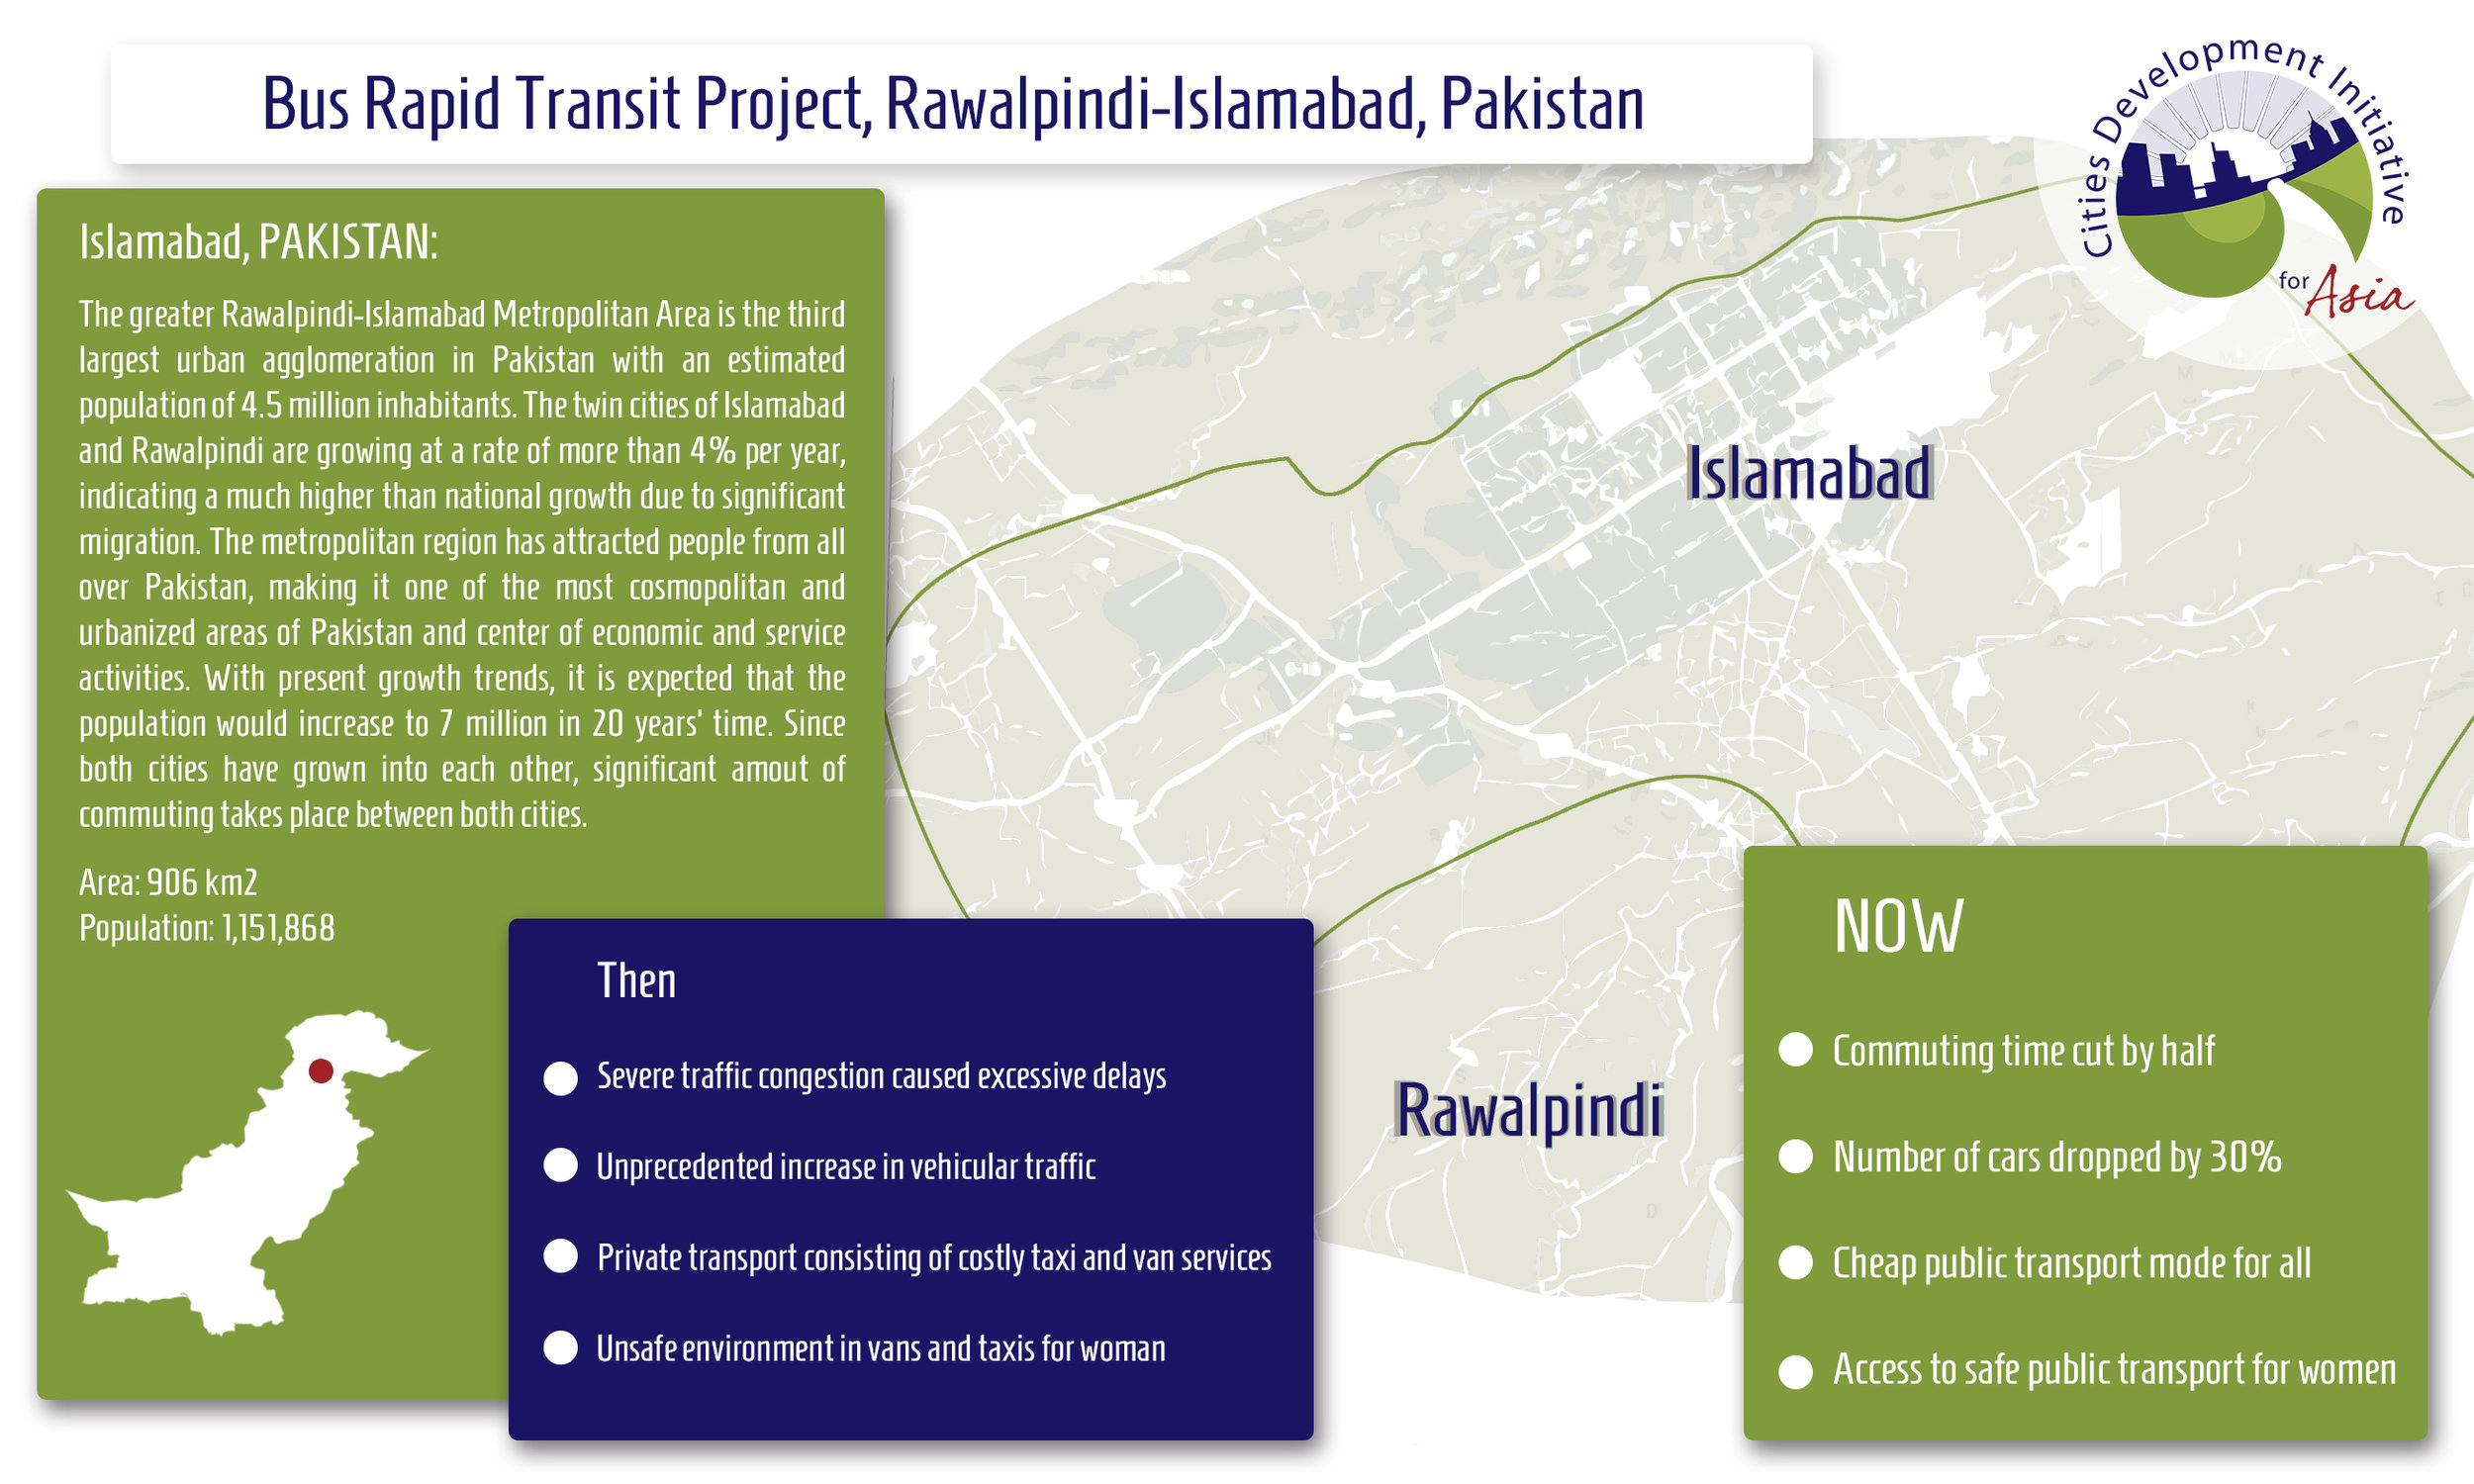
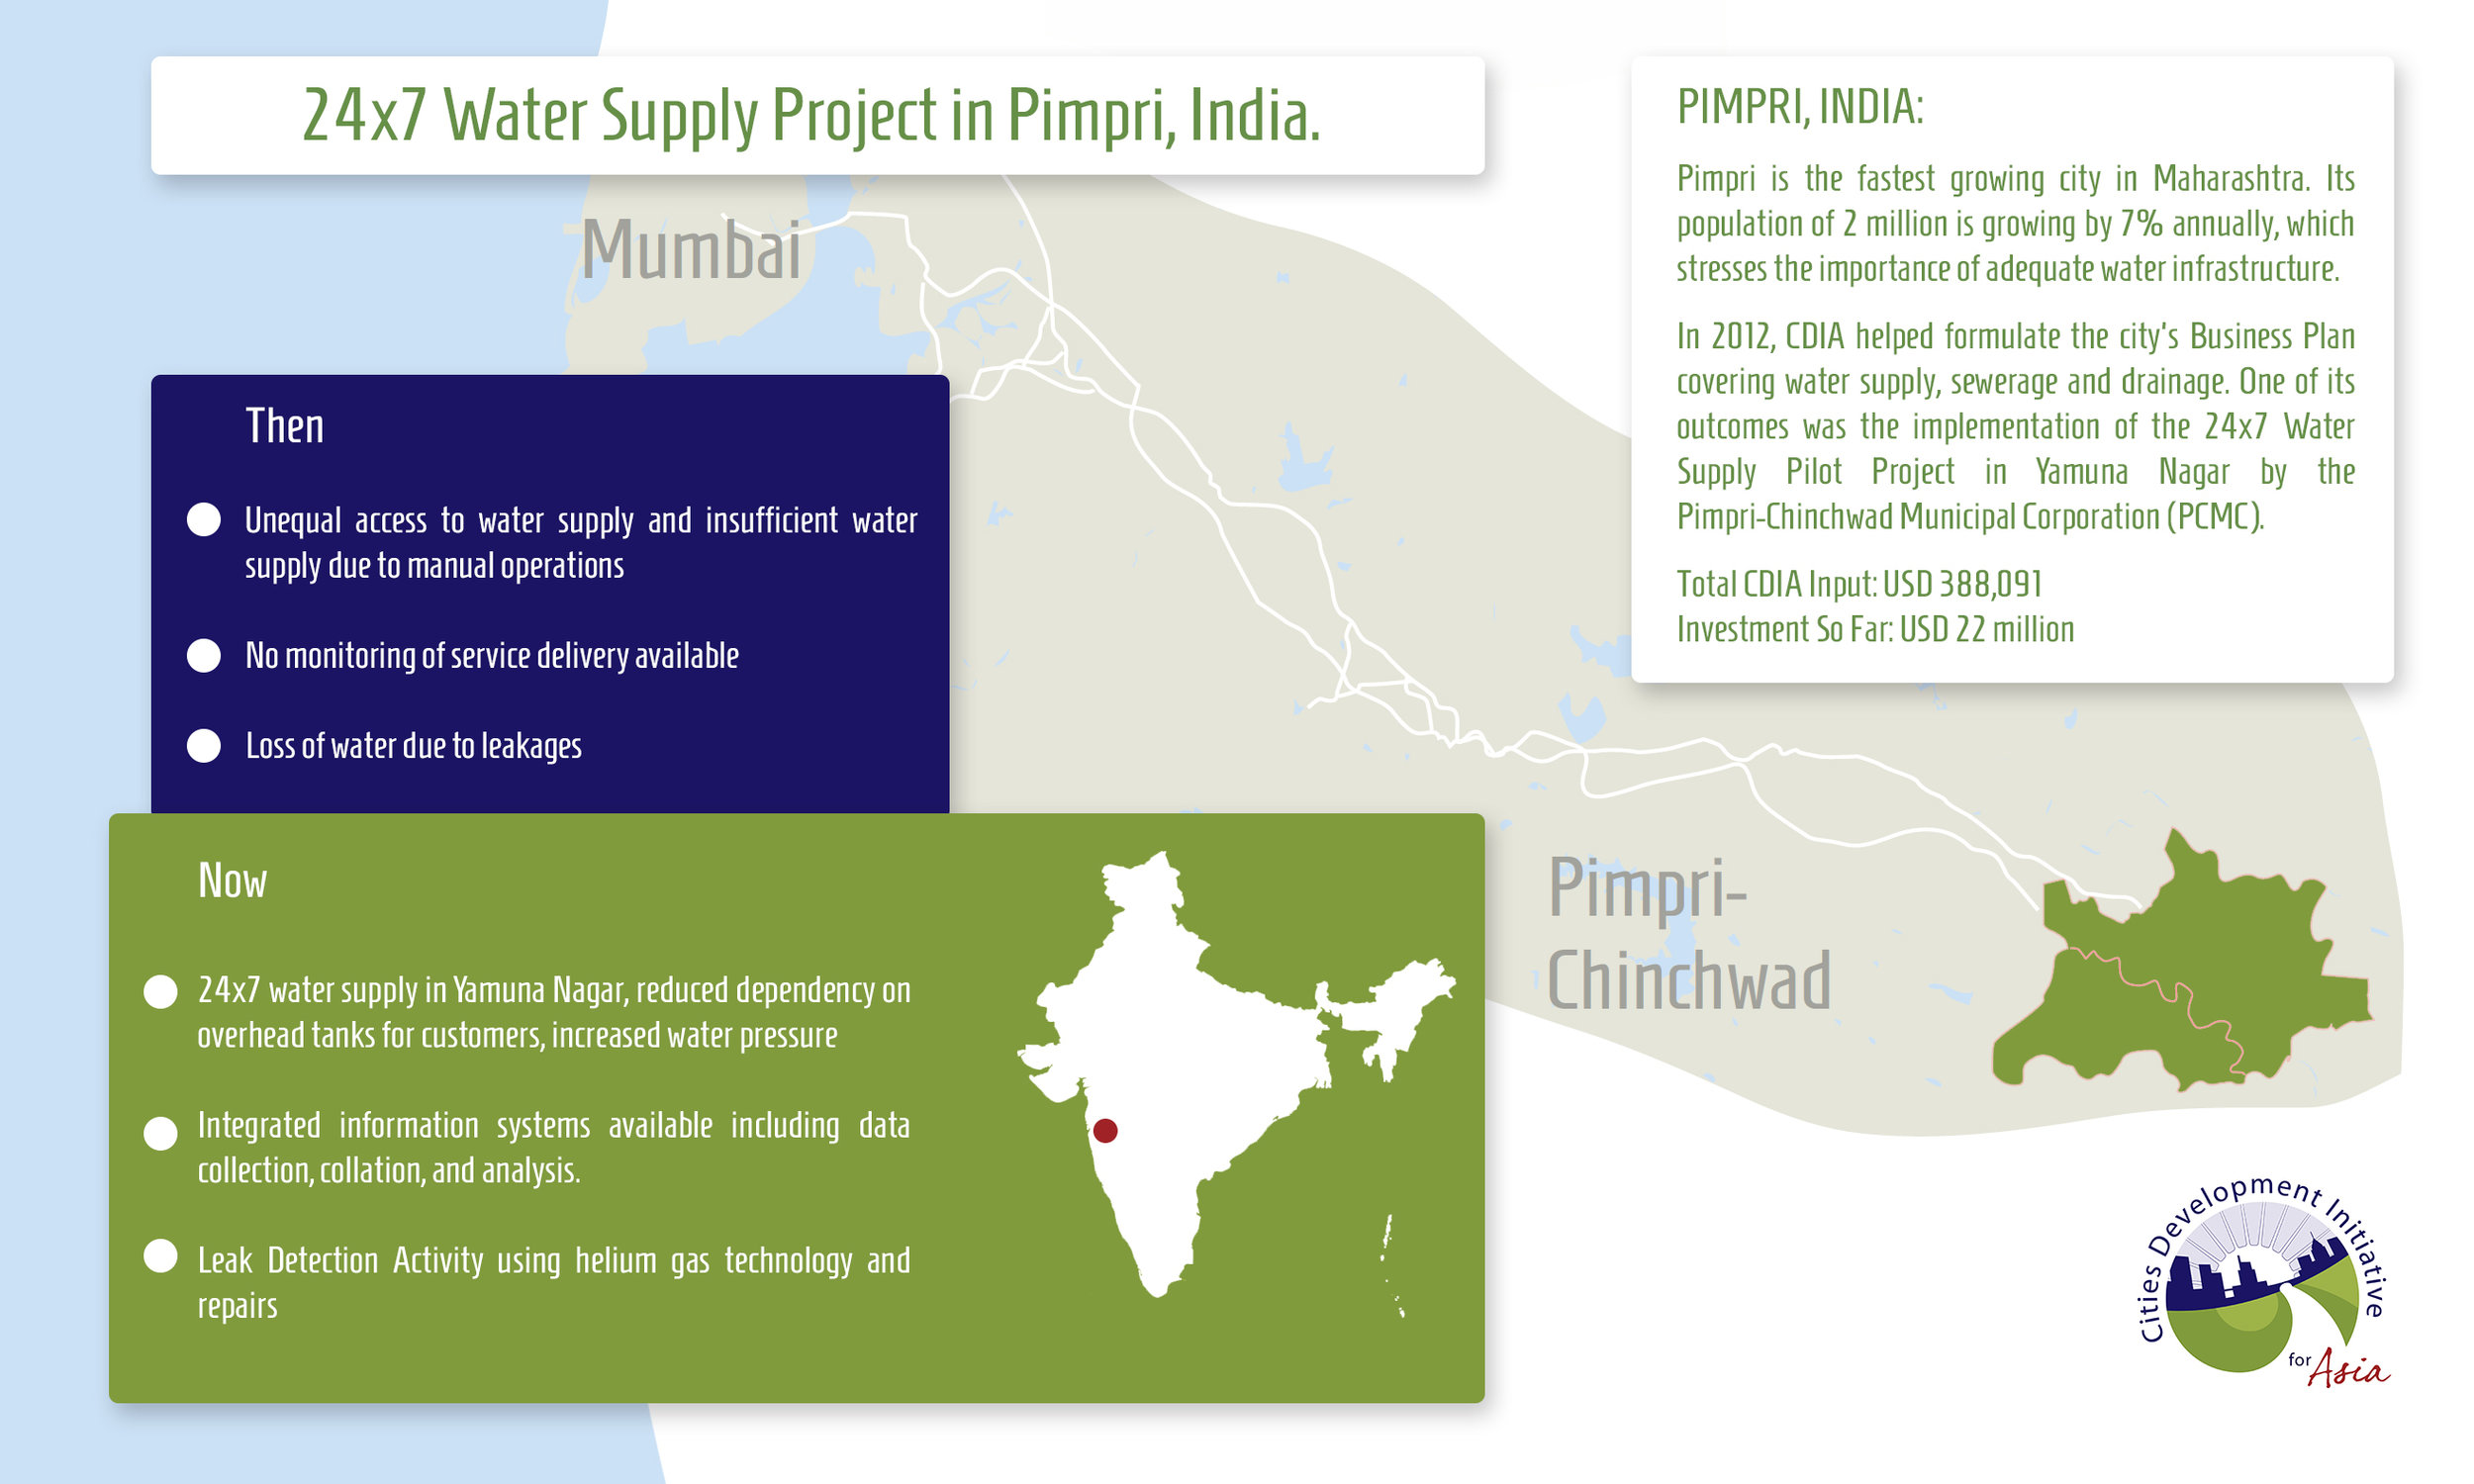
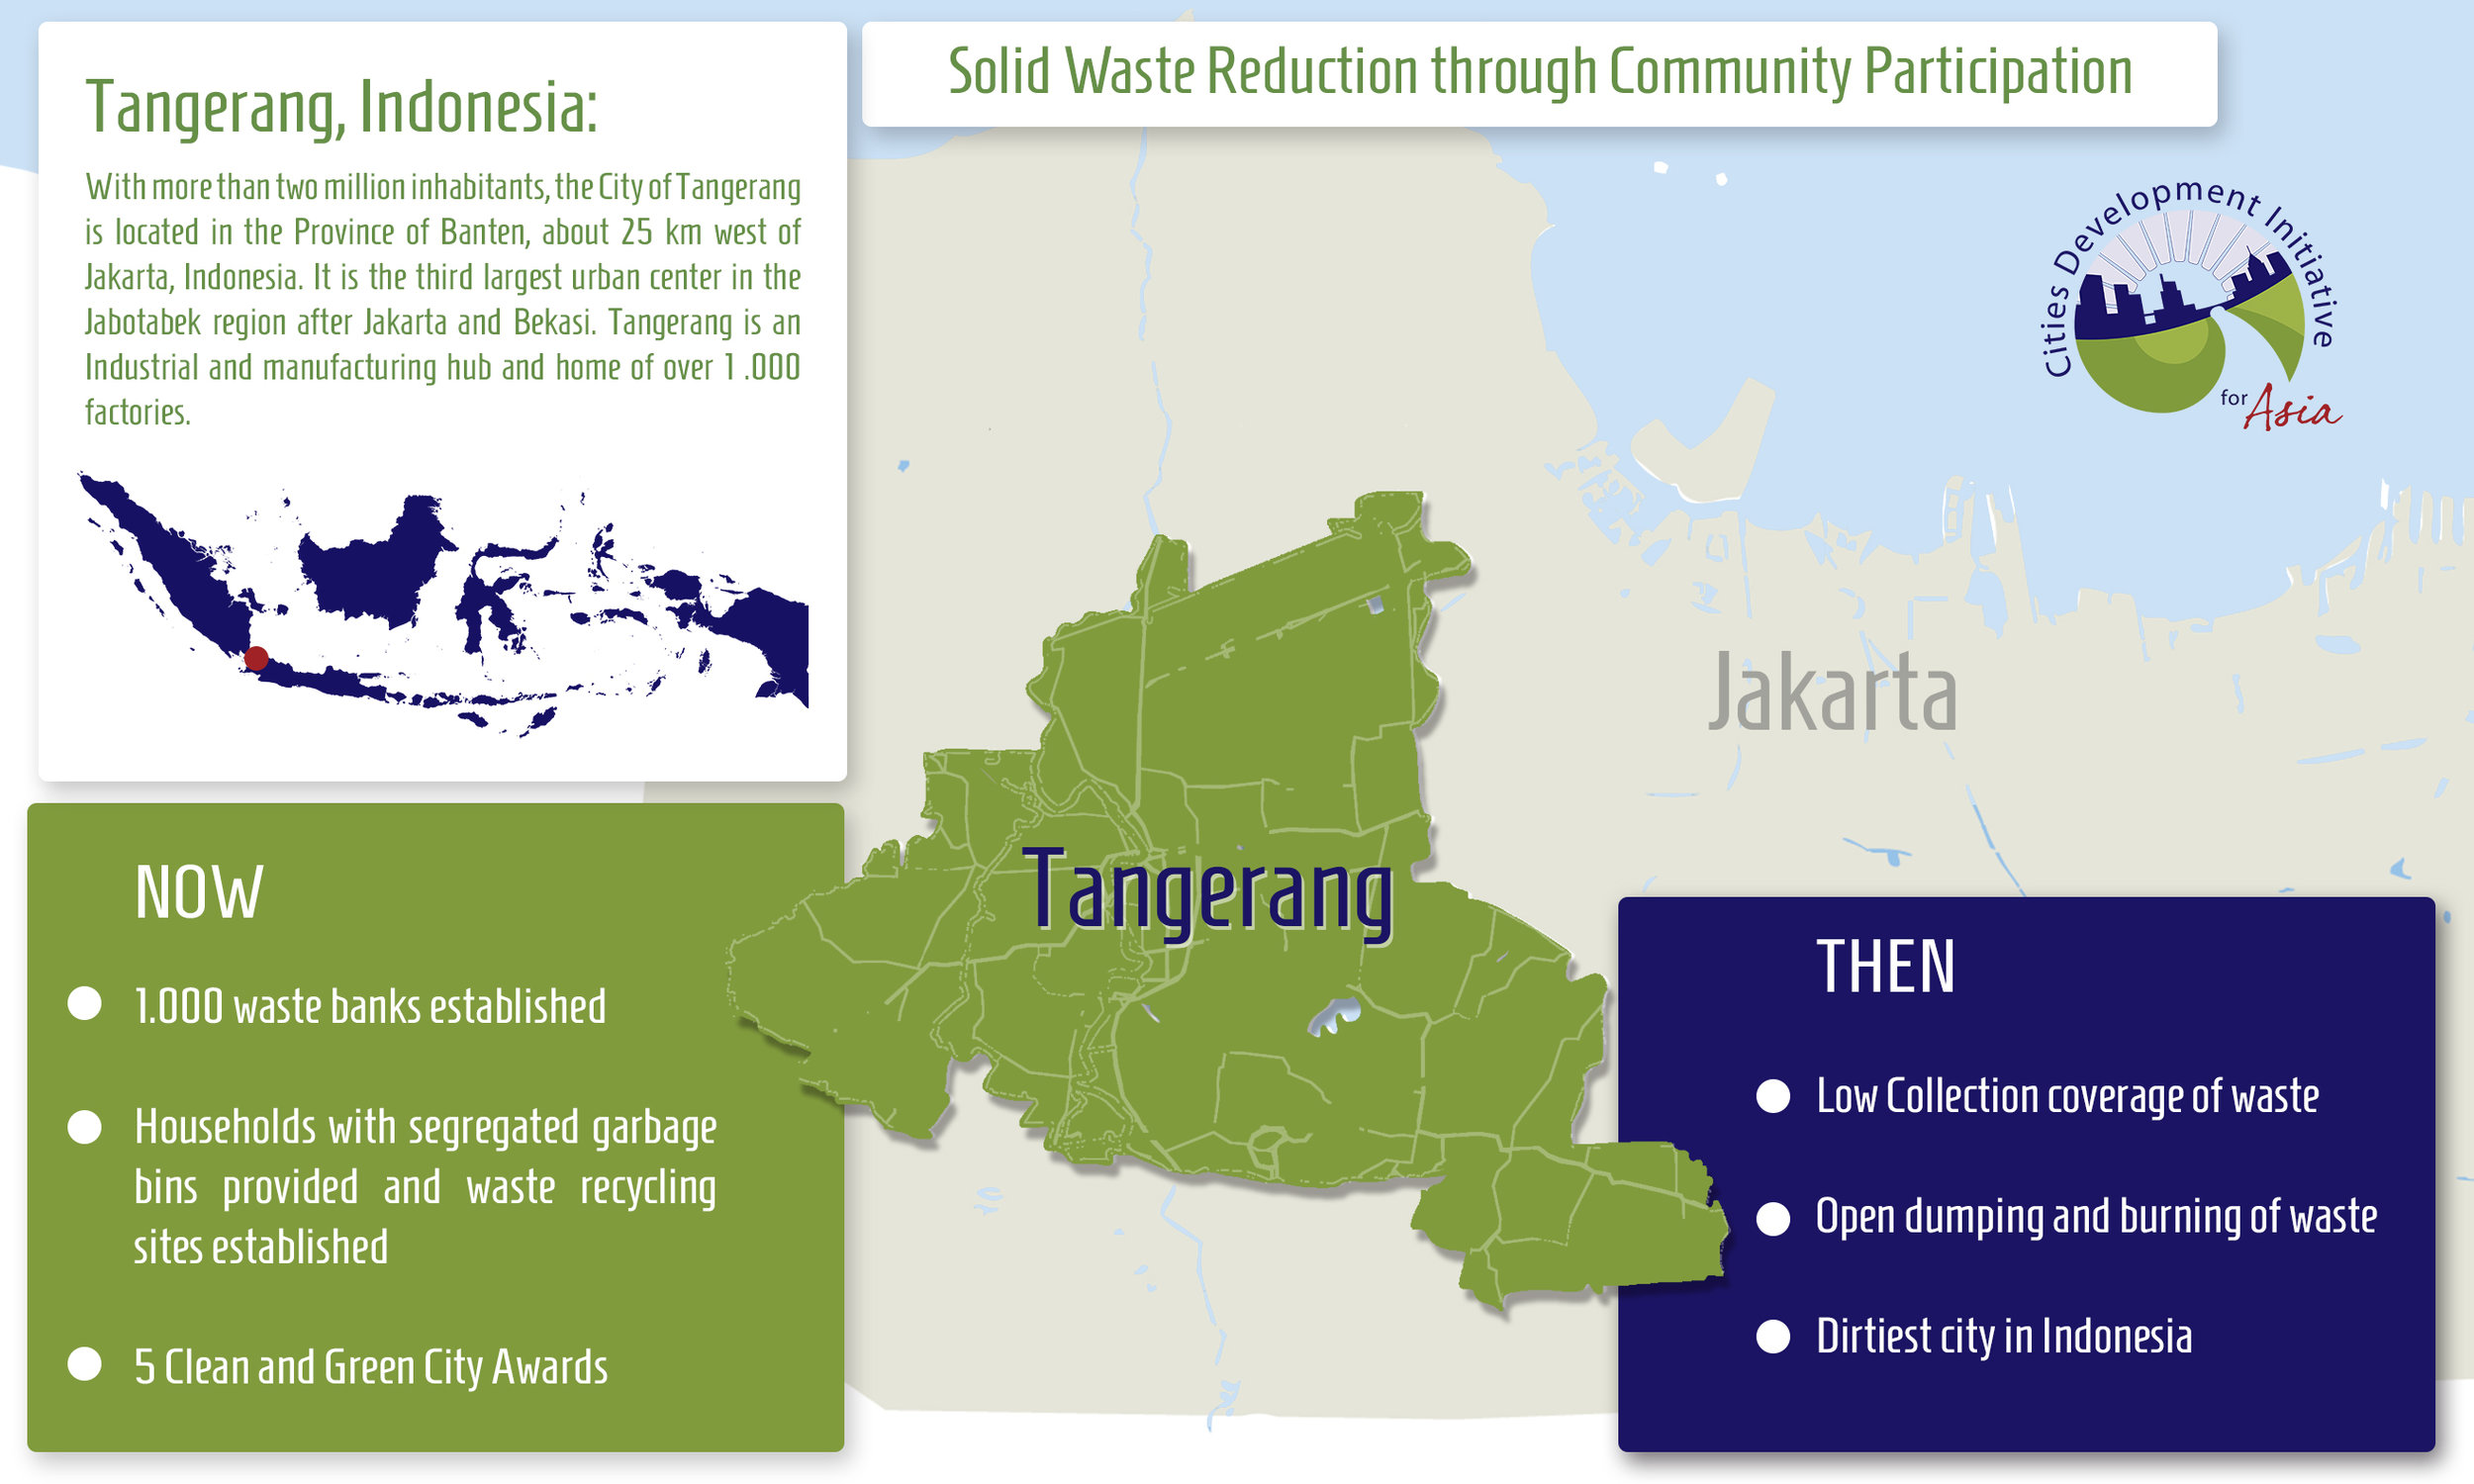
II. Posters & Design
Photography
Photography Part I.
Photography Part II.
Modelling
About
Menu
Julian Hoffmann Anton
Intro
Newsletter
Maps & Data Visualisation
I - 3D Maps and Networks
II - 2D Data Visualisation & Animation
III - 3D Motion Design
IV - 30DayMapChallenge - 2021 to 2023
V - 30DayMapChallenge - 2021
The Tokyo Eat Map Dream
The Geology of the Moon
The Breathing Planet
World Cup 2026
Behind-the-scenes
Collabs & Comissions
Contact
Awards
Store & Prints
Tutorials & Talks
Digital Art
Digital Painting
3D Art
Graphic Design
I. Logos & Icons
II. Posters & Design
Photography
Photography Part I.
Photography Part II.
Modelling
About
×
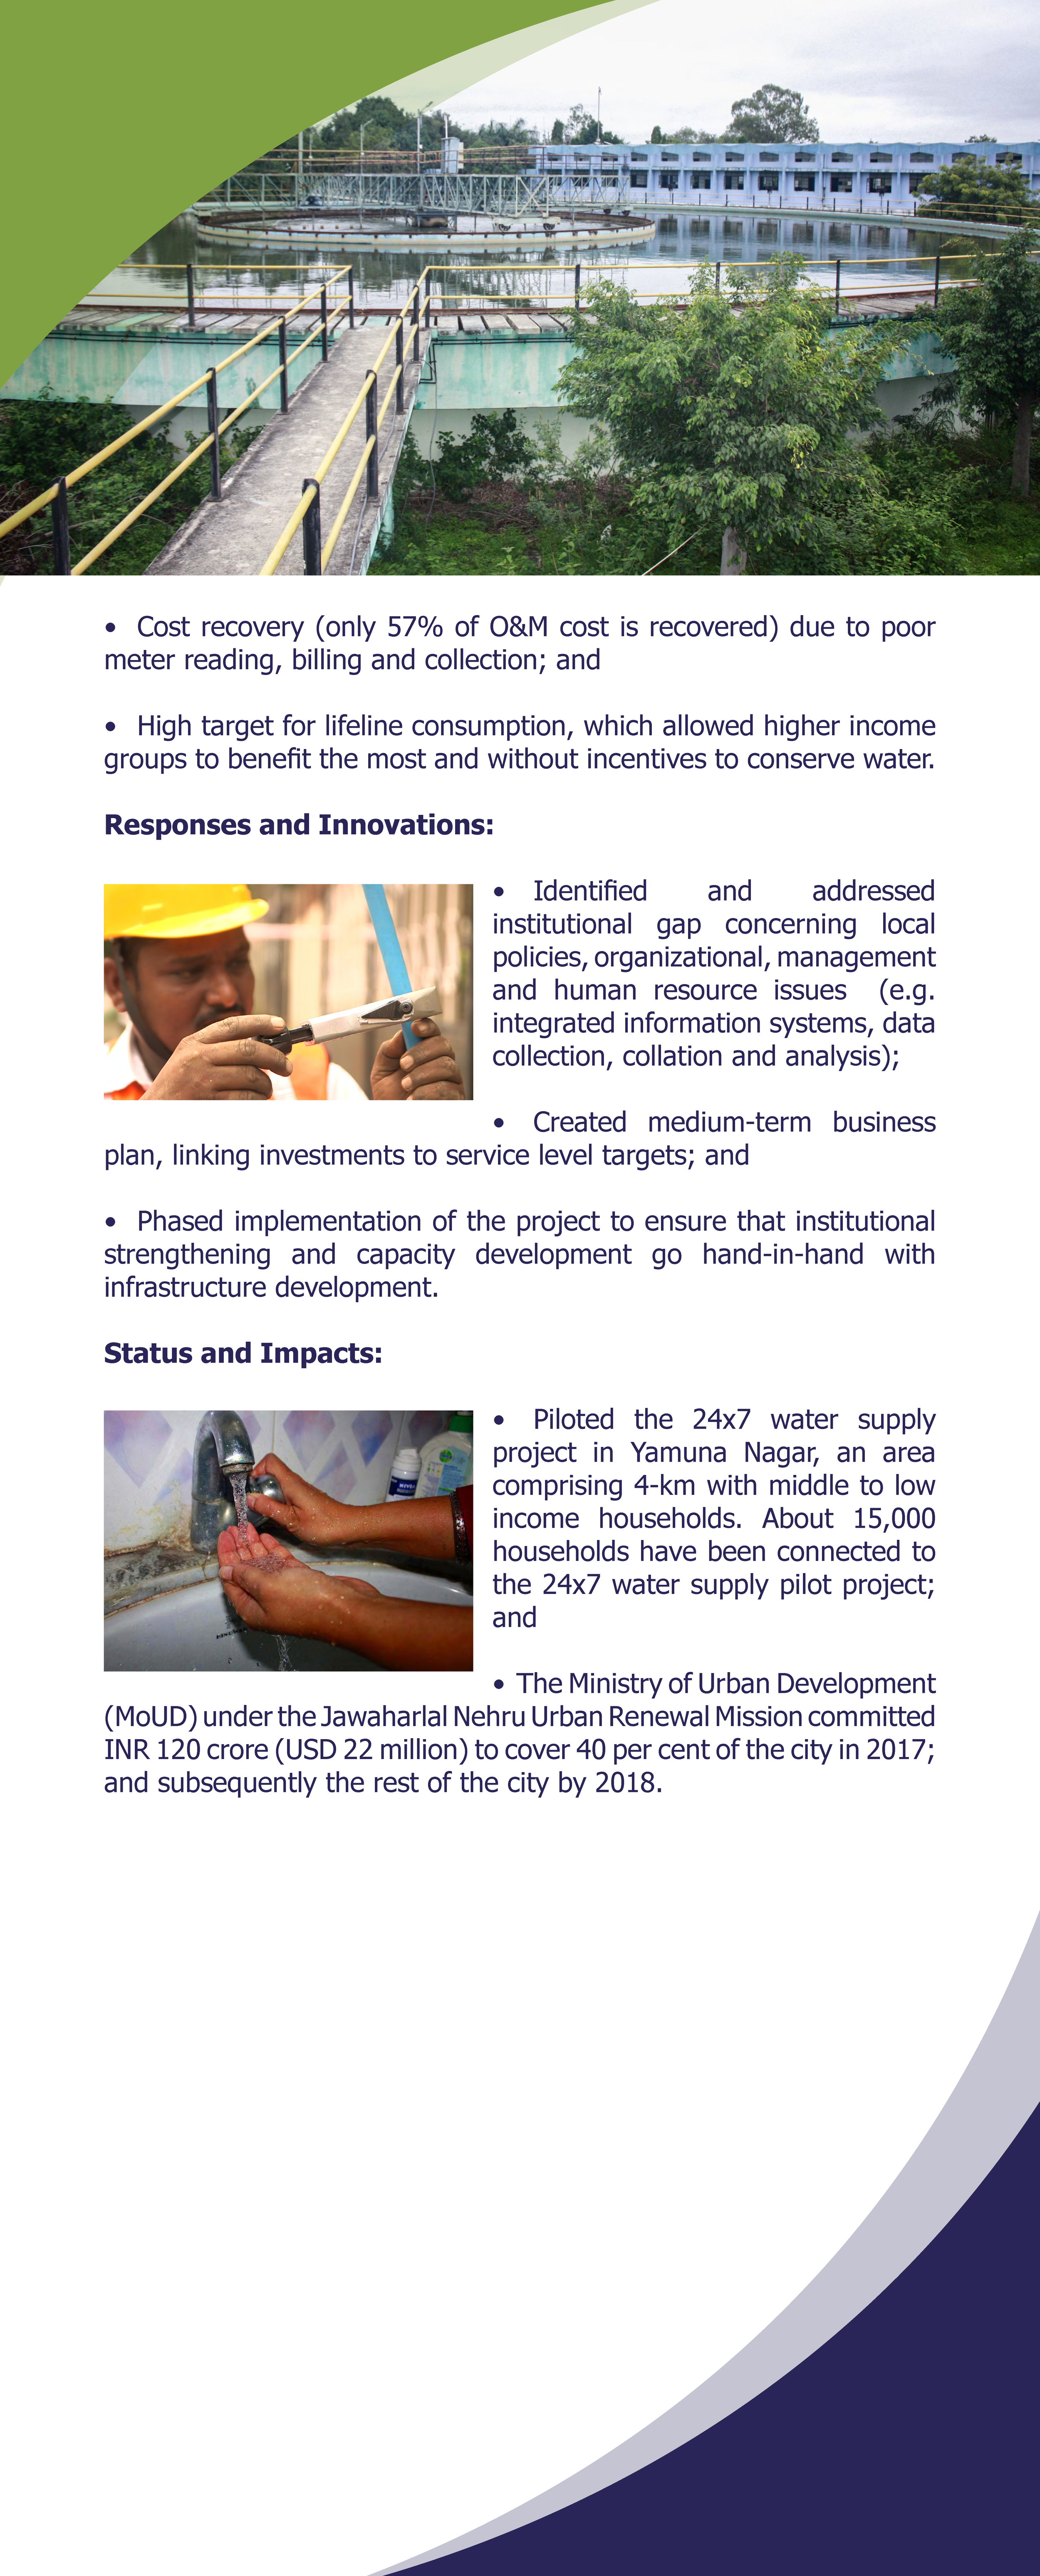
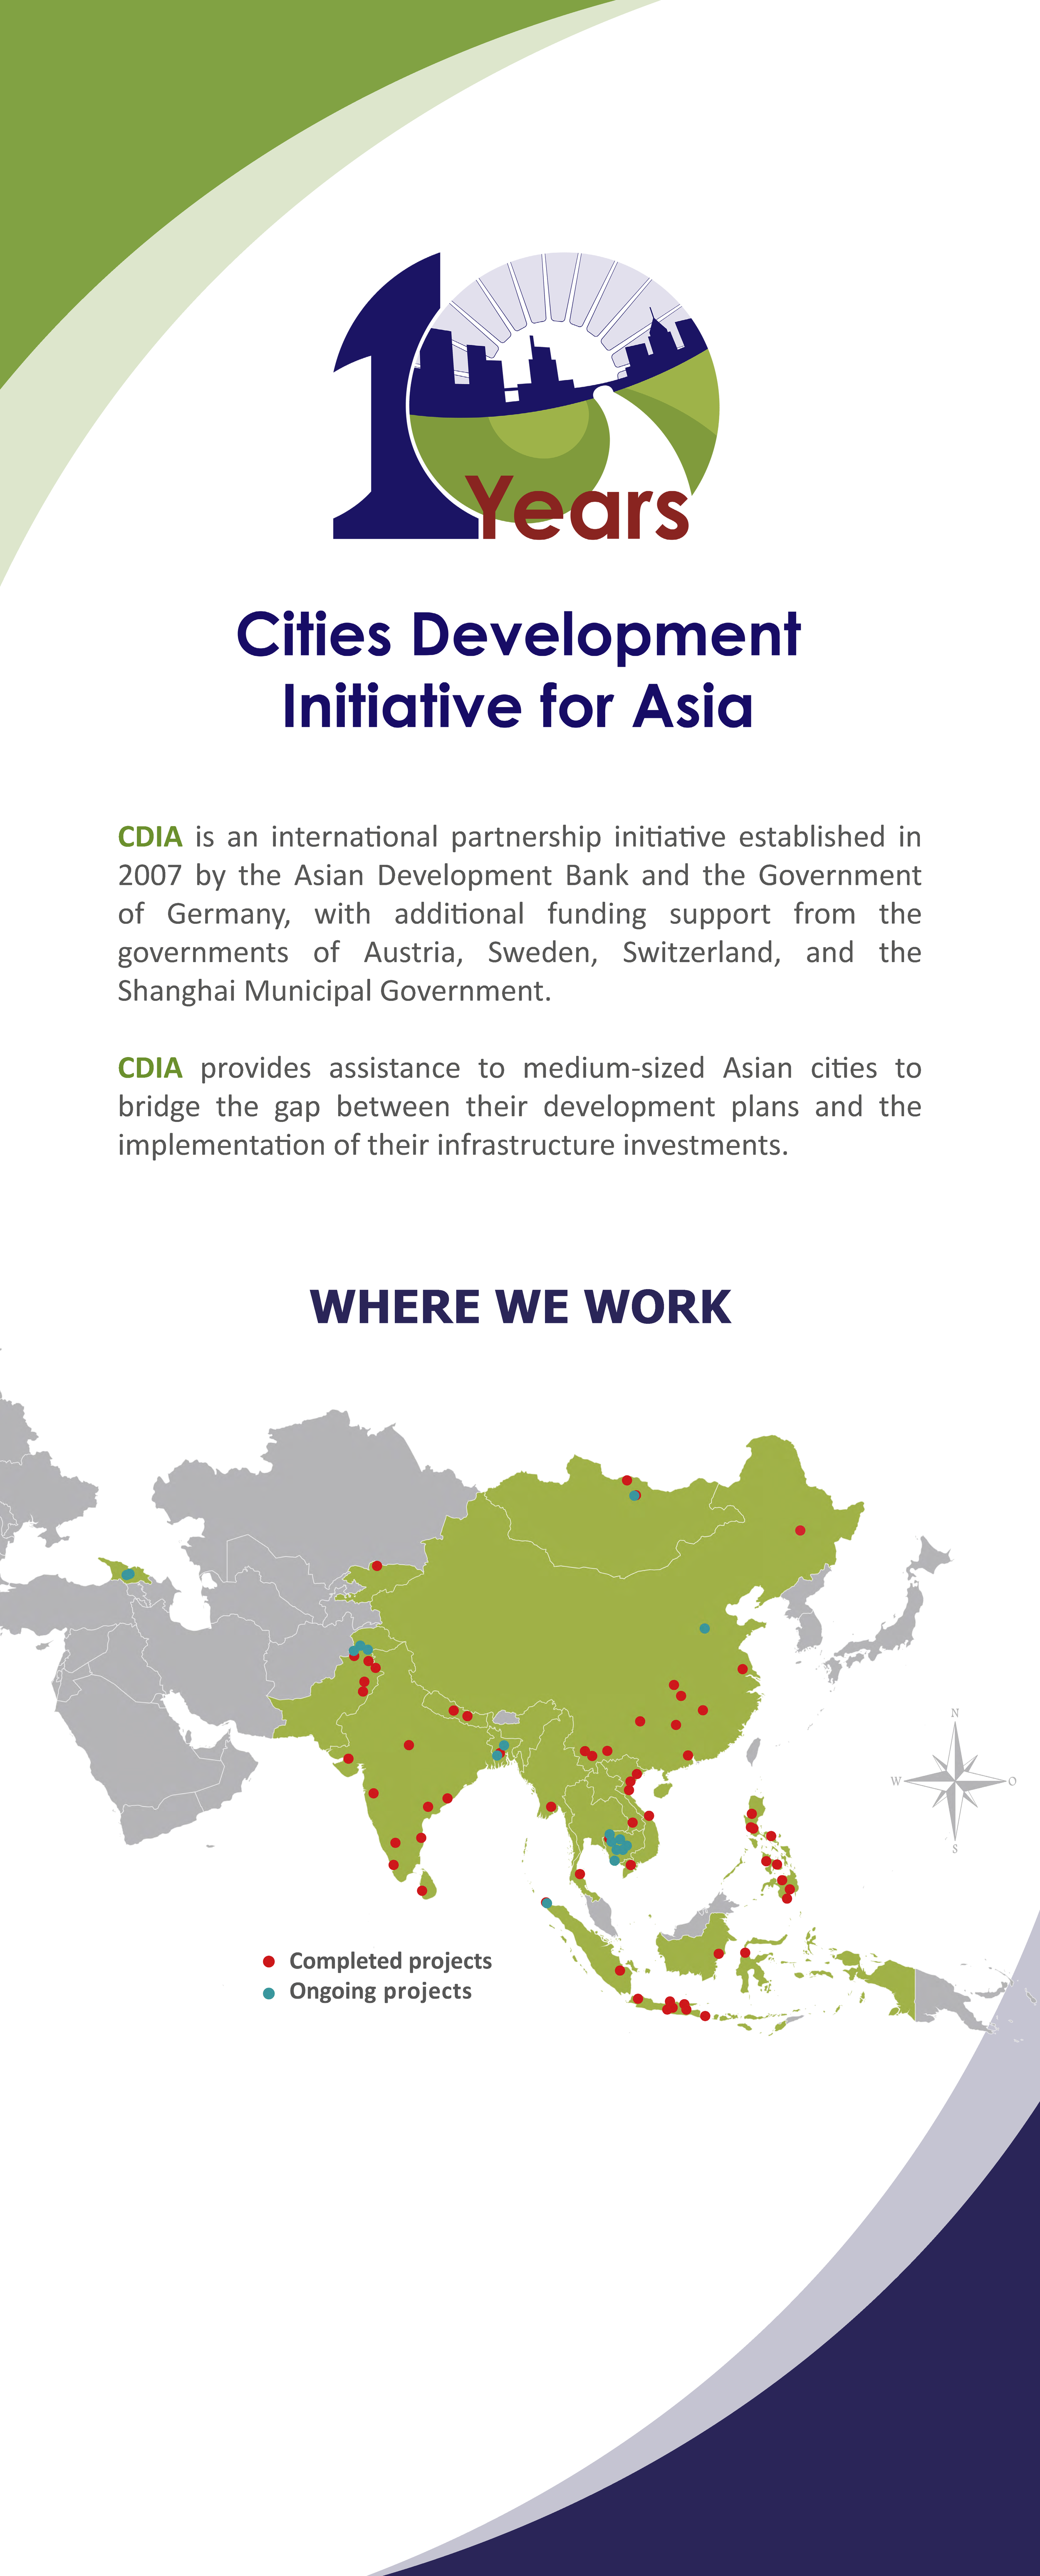
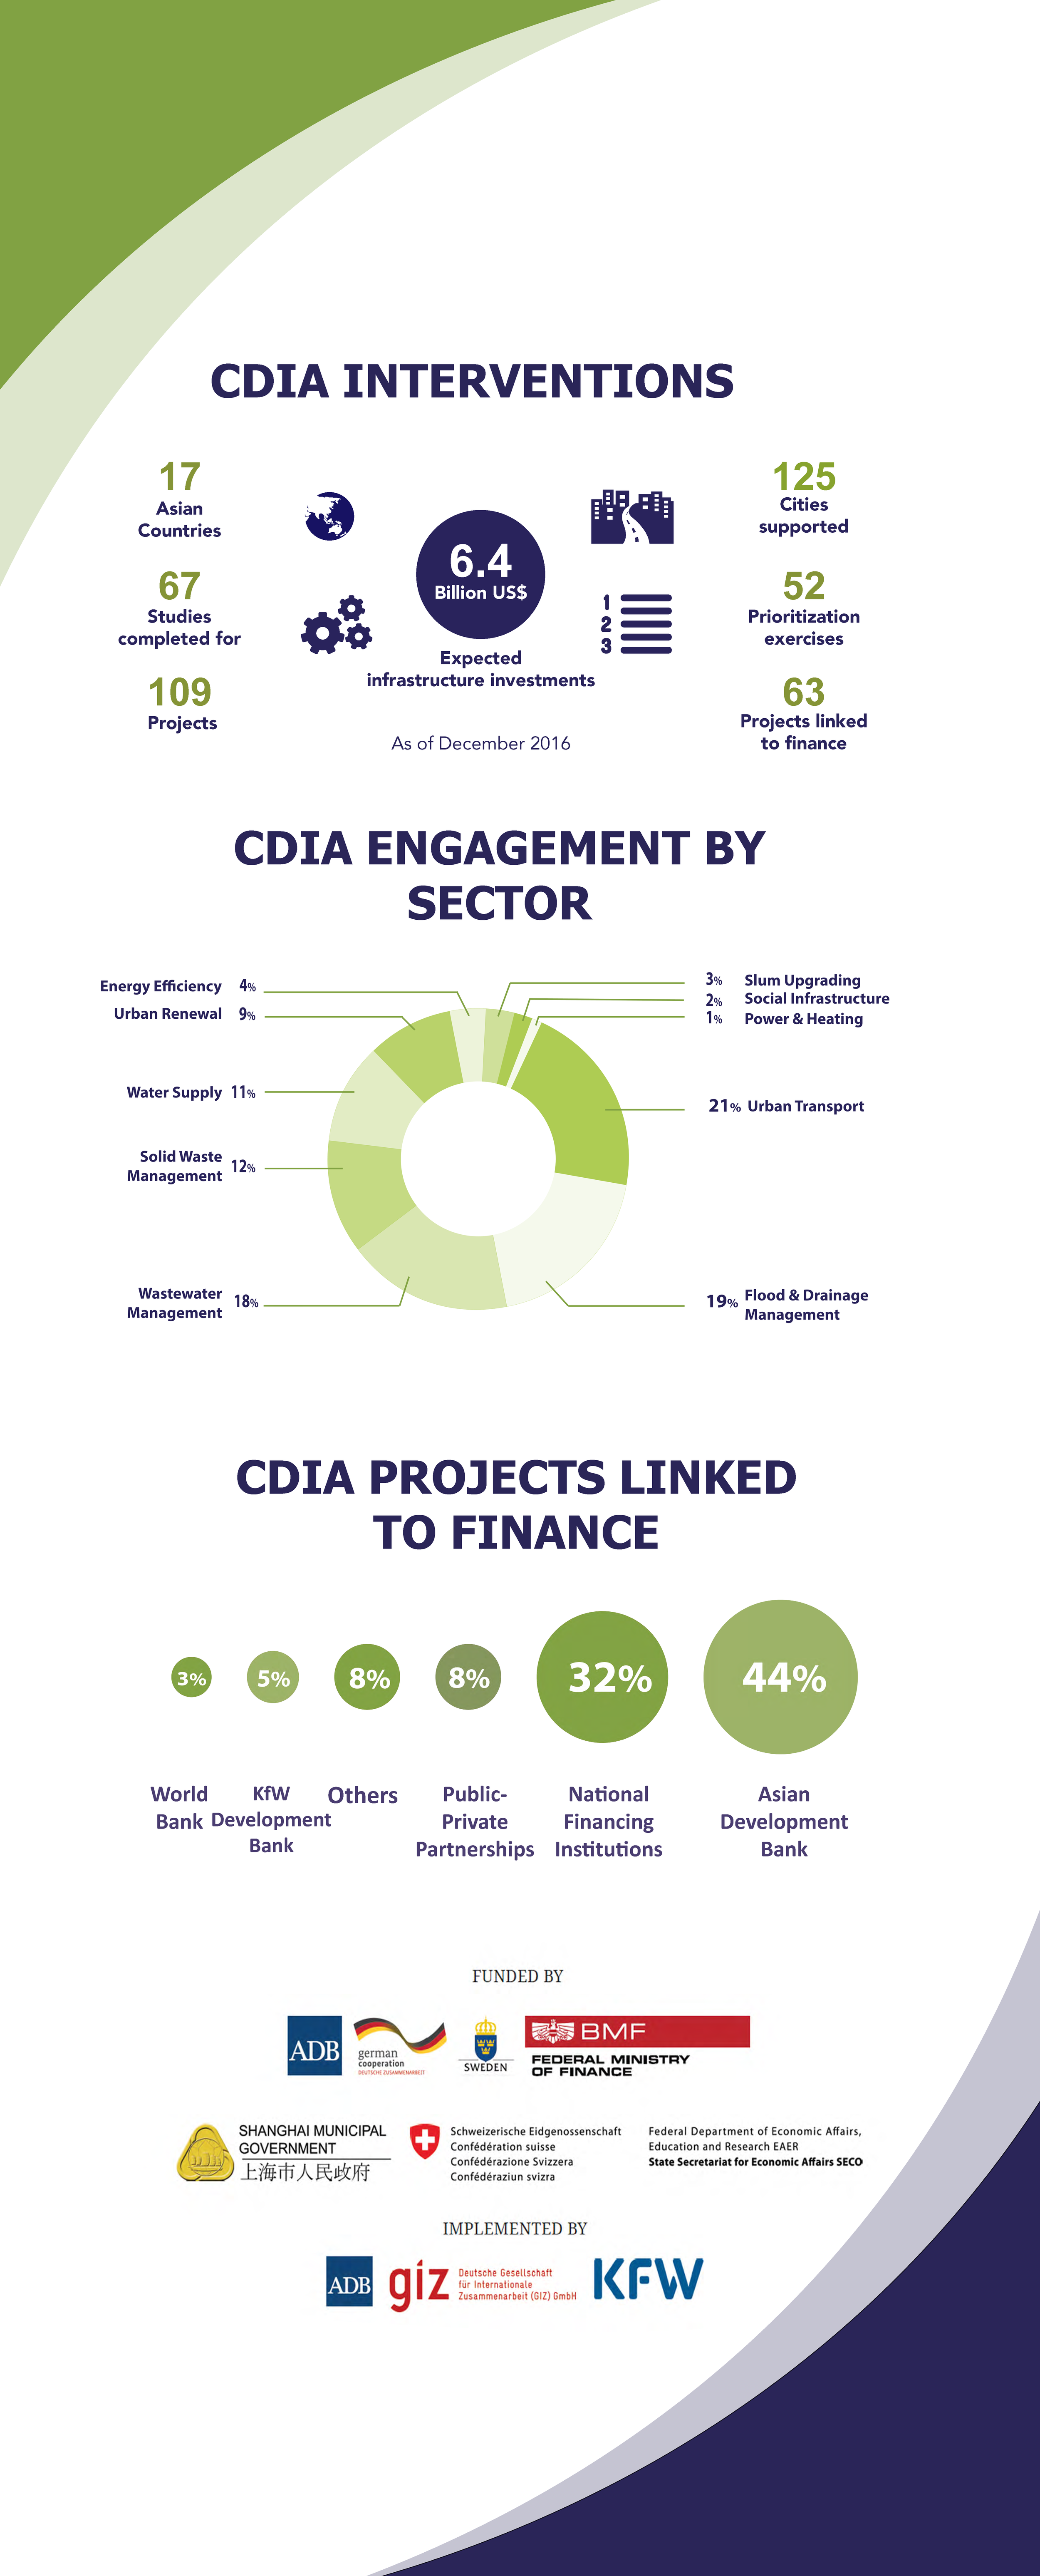
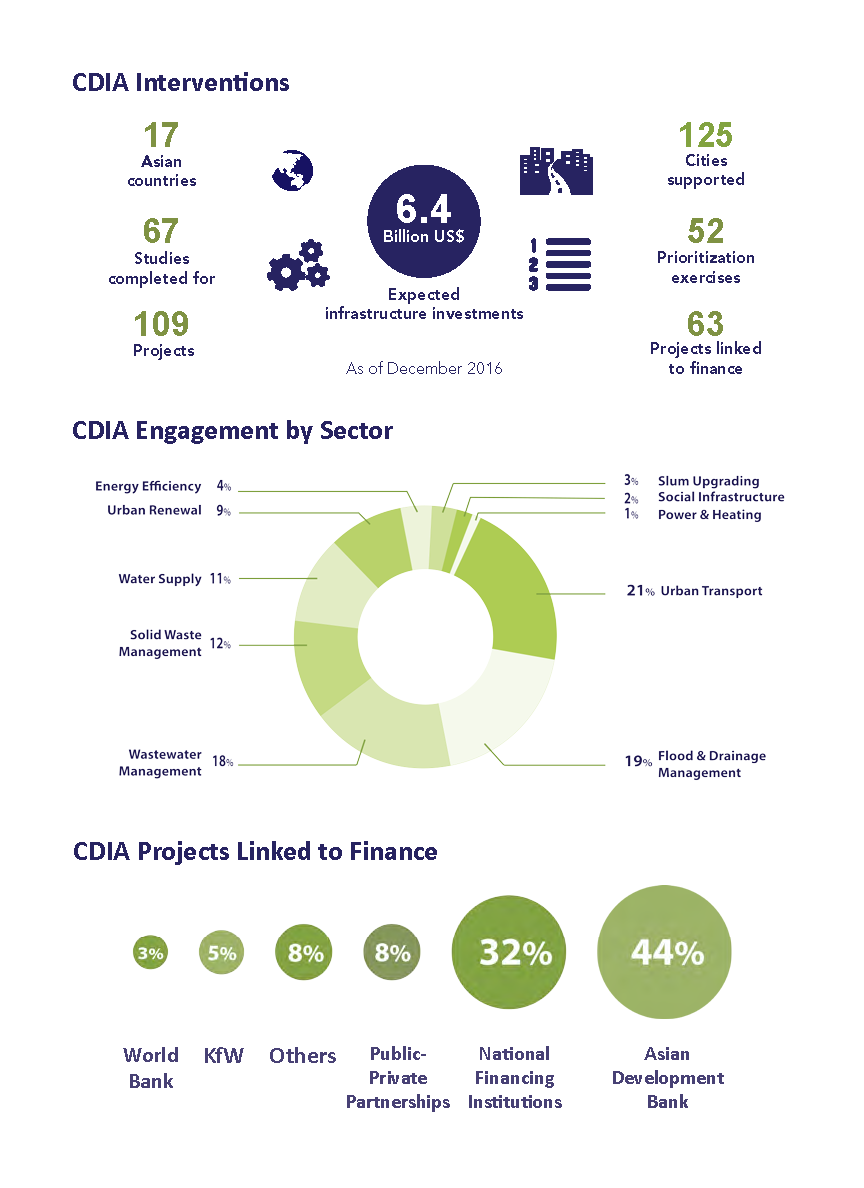
Graphic Design - Poster, Covers, Flyers, Roll-Ups etc